Reproducibility in Data Visualization

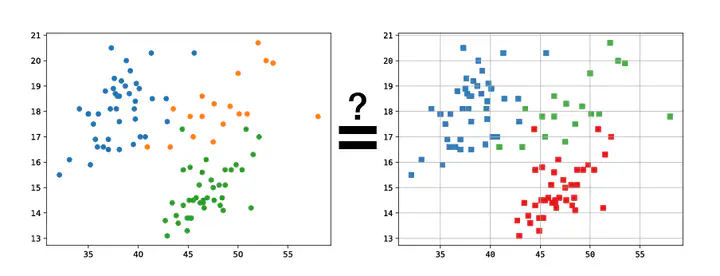
At the heart of evaluating reproducibility is a judgment about whether two results are indeed the same. This can be complicated in the context of data visualization due to rapidly evolving technology and differences in how users perceive the results. First, due to the rapid evolution of libraries including web technologies, visualizations created in the past may look different when rendered in the future. Second, as the goal of data visualization is communicating data to people, different people may perceive visualizations in a different way. Thus, when a reproduced visualization does not exactly match the original, judging whether they are “similar enough” is complicated by these factors. For example, changes in a colormap may be deemed minor by a computer but could lead people to different understandings of the data. The goals of this research are to capture visualizations in a way that allows their reproducibility to be evaluated and to develop methods to categorize the differences when a reproduced visualization differs from the original.
Investigate Solutions for Capturing Visualizations
- Topics: Reproducibility, Data Visualization
- Skills: Python and/or JavaScript, Data Visualization Tools
- Difficulty: Moderate
- Size: Medium or Large (175 or 350 hours)
- Mentors: David Koop
The goal of this project is to investigate, augment, and/or develop solutions to capture visualizations that appear in formats including websites and Jupyter notebooks. In past work, we implemented methods to capture thumbnails as users interacted with visualizations. Other solutions can be used to capture interactive visualizations. We wish to understand the feasibility of recording such visualizations and their utility in evaluating reproducibility in the future.
Specific tasks:
- Evaluate tools for capturing static visualizations on the web
- Investigate tools for capturing dynamic visualizations on the web
- Investigate how data including code or metadata can be captured with visualizations
- Augment or develop tools to aid in capturing reproducible visualizations
Categorize Differences in Reproduced Visualizations
- Topics: Reproducibility, Data Visualization
- Skills: Python and/or JavaScript, Data Visualization Tools
- Difficulty: Moderate/Hard
- Size: Medium or Large (175 or 350 hours)
- Mentors: David Koop
The goal of this project is to organize types of differences in reproduced visualizations and create tools to detect them. Publications and computational notebooks record renderings of visualizations. When they also include the code to reproduce the visualization, we can regenerate them in order to compare them. Often, the reproduced visualization does not match the original (see examples in this manuscript). This project seeks to categorize the types of differences that can occur in order and start understanding how they impact judgments of reproducibility.
Specific tasks:
- Evaluate and/or develop tools to compare two visualizations
- Evaluate the utility of artificial intelligence solutions
- Organize and categorize the detected differences
- Develop tools to determine the types or categories of differences present in two visualizations